Hands-on Amazon Growth Partner
Focus on what moves the business.
Then execute until the numbers move.
For established Amazon brands. I find the few levers that matter most — then work them myself, inside Seller Central and Amazon Ads.
Everything else waits.
How I work
Most brands don’t need more activity.
They need better priorities — and someone to execute them.
Diagnose
Ads, catalog, pricing and P&L — read as one system.
Focus
Pick the few levers that move profit. Park the rest.
Execute
Hands-on, inside the accounts.
Measure
Against the baseline. Scale, fix or stop.
Focus & Prioritization
Focusthe few levers
that matter
- PPC
- Profitability
- Catalog Restructuring & CRO
- Launches & Organic Growth
- Brand & Market Expansion
The levers that lead change from business to business
I read the business as one connected system, identify the few levers that matter most — and execute them together.
Results
Recent work with established Amazon brands.
Client names are withheld. The logic, the work and the evidence are shown for each case.
Case 01Catalog · CRO · Pricing · PPC
~3×
monthly revenue
~£60K → ~£170K average monthly sales
Monthly profit ~£15K → ~£32K in approximately 5 months
View case & evidence
The case
SituationA UK Health & Personal Care brand had solid products but significant room to improve conversion, pricing, market positioning and advertising efficiency.
FocusCatalog & conversion, competitive positioning, pricing architecture, keyword opportunity and PPC execution.
ActionsReworked the core product pages, repositioned pricing against the competitive set, identified the highest-opportunity search terms and implemented a focused PPC management system around the products and keywords with the strongest economics.
ResultWithin approximately five months, average monthly revenue grew from ~£60K to ~£170K, while average monthly profit increased from ~£15K to ~£32K.
Inside the account
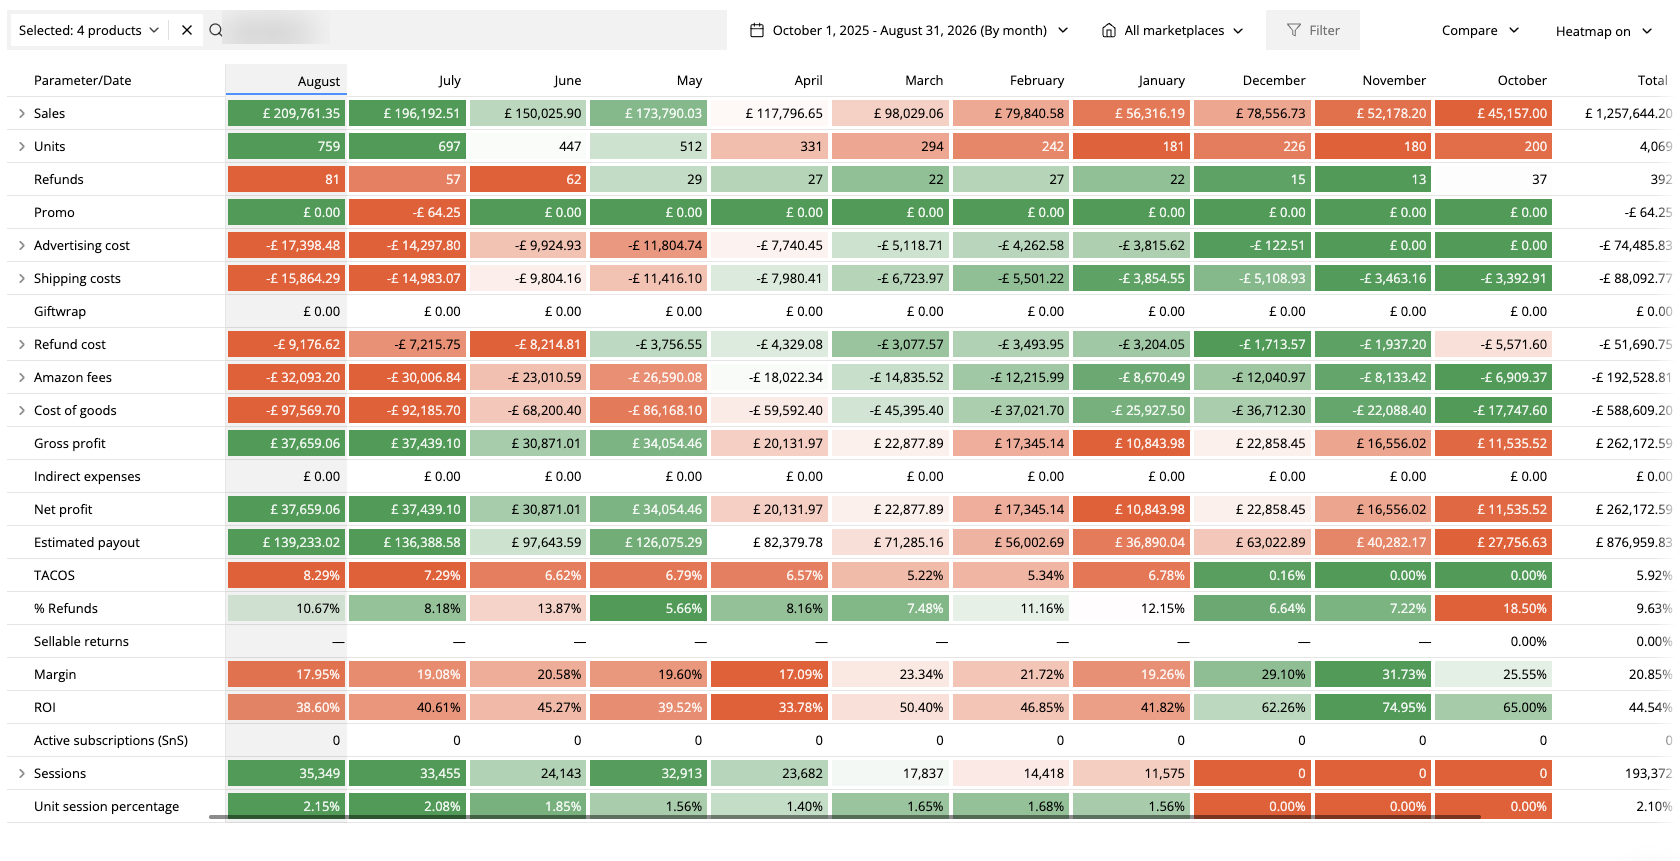
Sellerboard data from the account. Engagement started March 2026.
1Product pages reworked2Pricing repositioned3Keyword opportunities mapped4Focused PPC system
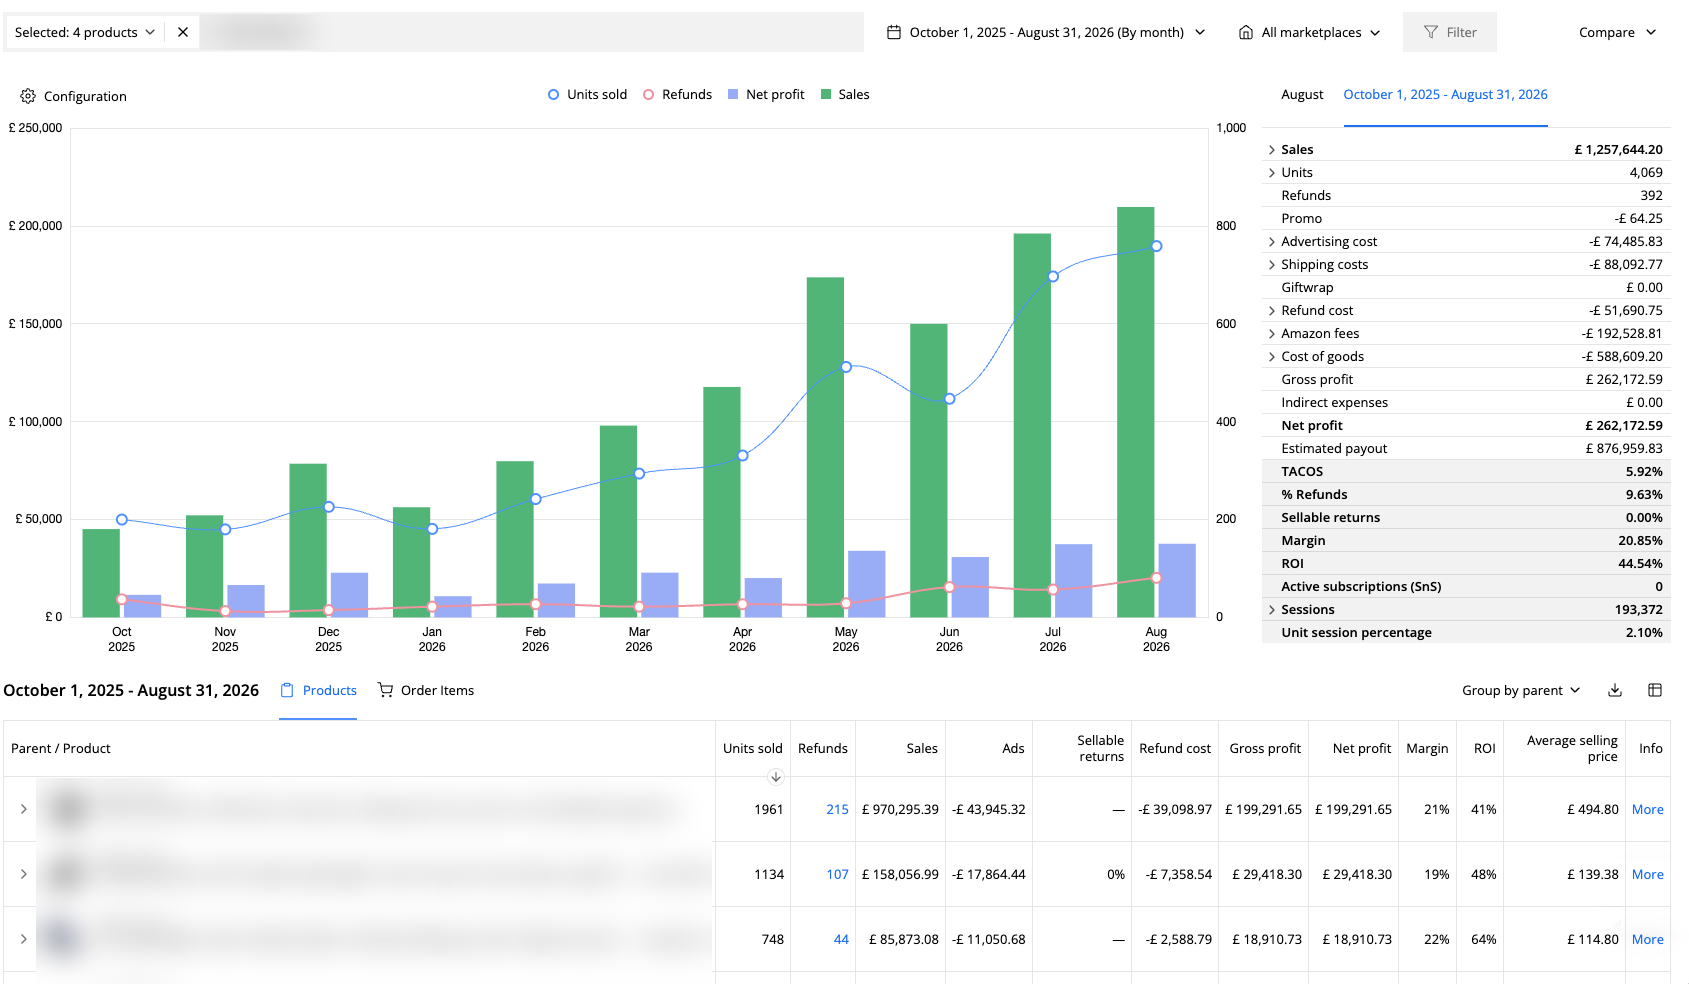
- Mar 2026 Engagement started
- Before ~£60K avg monthly revenue · ~£15K avg monthly profit
- After ~£170K avg monthly revenue · ~£32K avg monthly profit
Case 02PPC · Pricing · Scale
#2
Best Seller
PPC reallocation + pricing move accelerated sales, profit and category position
From underfunded top SKU → aggressive profitable scale
Wk 5Weekly net profitWk 17
View case & evidence
The case
SituationAn apparel-accessories brand in Clothing, Shoes & Jewelry already had demand, but ad spend wasn’t following the economics. The best-converting SKU received only around 50% of total spend — capping both paid scale and the organic rank momentum that comes with it.
FocusBudget allocation · Scaling the winners · Price & deal mechanics · Organic rank
ActionsRestructured spend toward the highest-converting campaigns and products, pulling budget out of lower-value traffic. Once the structure was clean, scaled the top performers aggressively. Then launched a deal and moved price from $18.99 to $14.99 to drive volume — capturing the lower referral fee during the deal window — and ran paid and organic growth as one system.
ResultWeekly net profit and units rose sharply after the takeover. The product reached #2 in its Best Sellers subcategory, and its main-category rank moved from roughly #30,000+ in early February to #3,946 — a materially stronger position against the category leader.
Inside the account
Sellerboard weekly data (weeks 5–17 of 2026) and Keepa price & rank history. Engagement started around week 7.
1Spend moved to the top SKU2Top performers scaled3Deal: $18.99 → $14.994#2 in subcategory
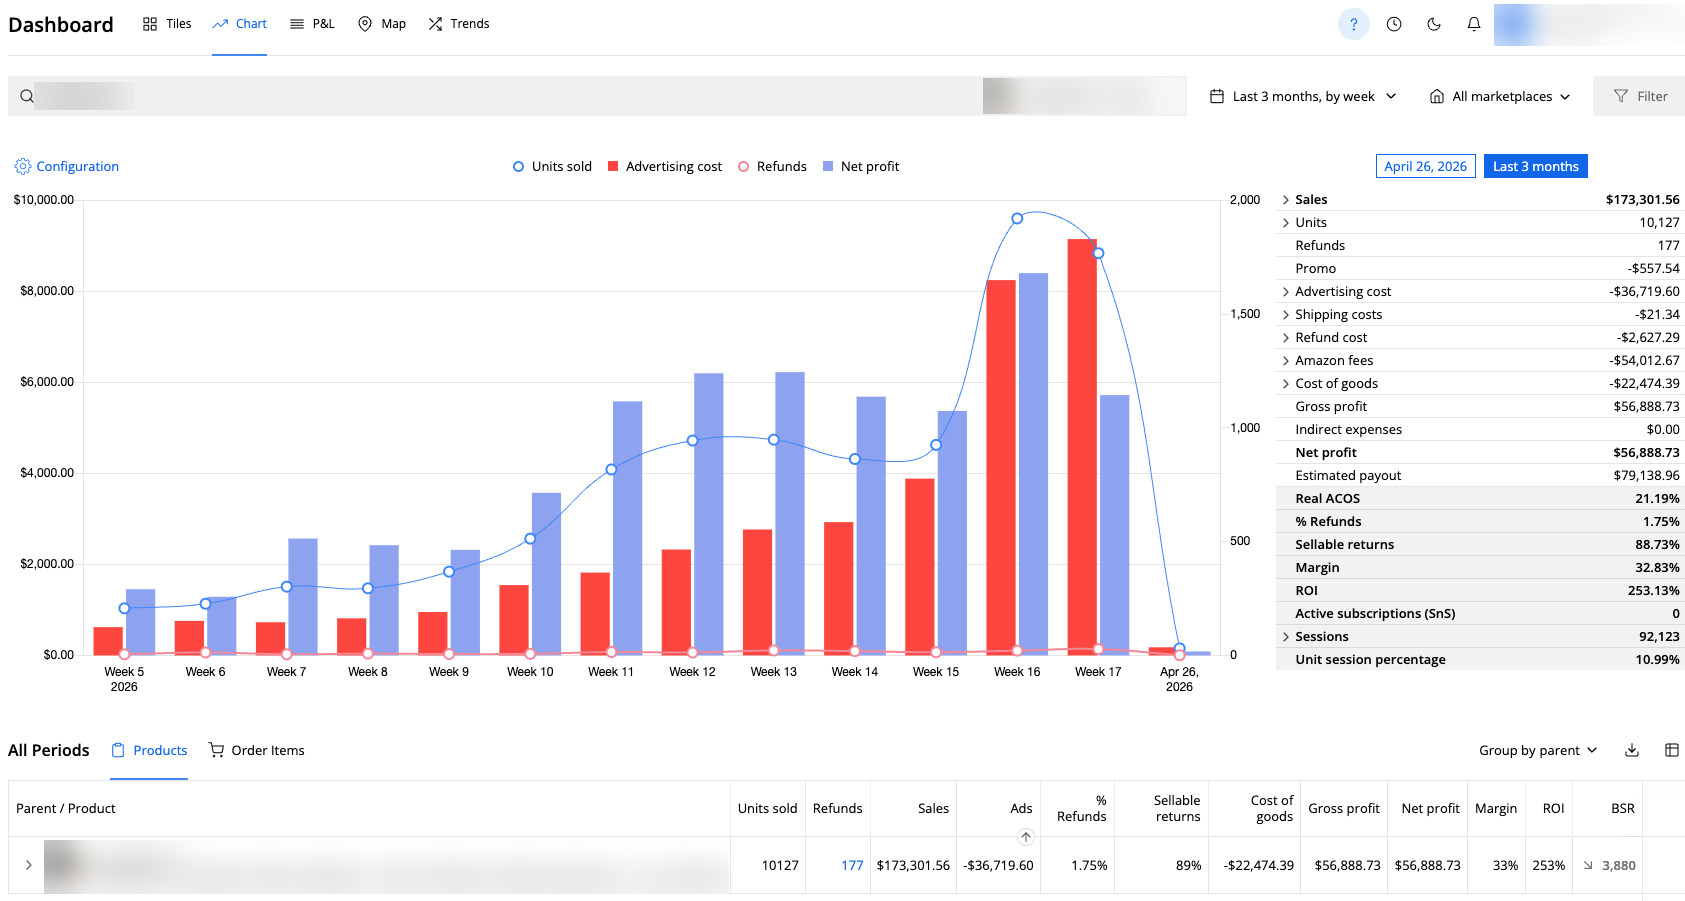
- Week 7 Engagement started
- Before Weeks 5–6
- After Weeks 7–17 (takeover)
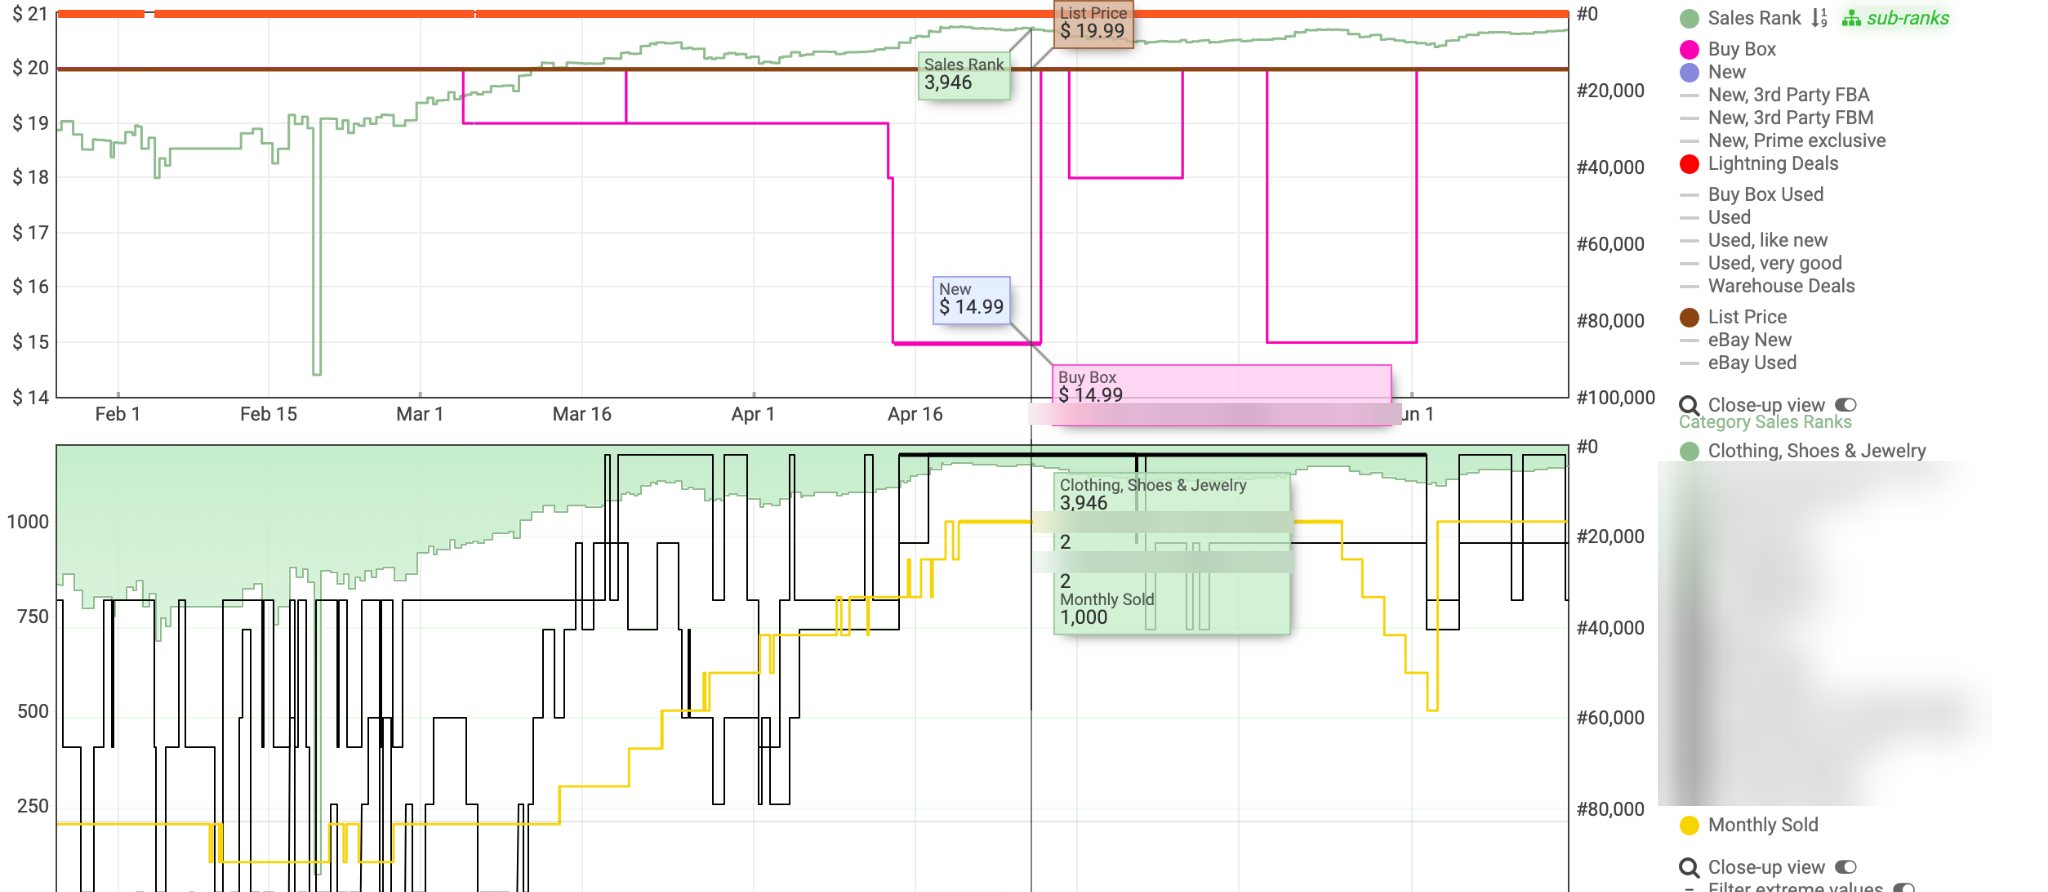
- Week 7 Engagement started
- Price $18.99 → $14.99 deal price
- Rank Main category ~#30K+ in early Feb → #3,946; #2 in subcategory
Case 03Catalog · Ad efficiency · Deals · PPC
~2×
monthly net profit
~$190K → ~$370K average monthly profit
On roughly flat unit volume and essentially the same ad spend
View case & evidence
The case
SituationA large Home & Kitchen seller — roughly $40M a year across a broad catalog. Scale wasn’t the problem; profitability was. The catalog structure had drifted and a meaningful share of ad spend wasn’t earning its keep.
FocusCatalog structure · Ad waste · Deal strategy · Rank-focused PPC
ActionsMarch — catalog. Restructured the catalog: merged variations where it made sense and separated listings that needed to be reconnected correctly, improving catalog logic, product attractiveness and AOV. April–May — profitability. Cut unnecessary ad spend hard and tightened the advertising structure. May–August — profitable scale. With margin flexibility restored, introduced a more aggressive deals strategy and focused PPC on the keywords most likely to lift organic rank.
ResultAverage monthly net profit roughly doubled, from ~$190K (Nov–Feb) to ~$370K (May–Aug), while monthly units stayed roughly flat and average ad spend was essentially unchanged at ~$320K a month. Organic position improved too: on one core product, the 90-day average Best Sellers rank (#1,686) is ahead of its 12-month average (#1,956).
Inside the account
Sellerboard data for the whole account (last 12 months) and Keepa history for one core product. Engagement started March 2026.
1Catalog restructured · Mar2Ad waste cut · Apr–May3Deals + rank-focused PPC · May–Aug4Organic rank improved
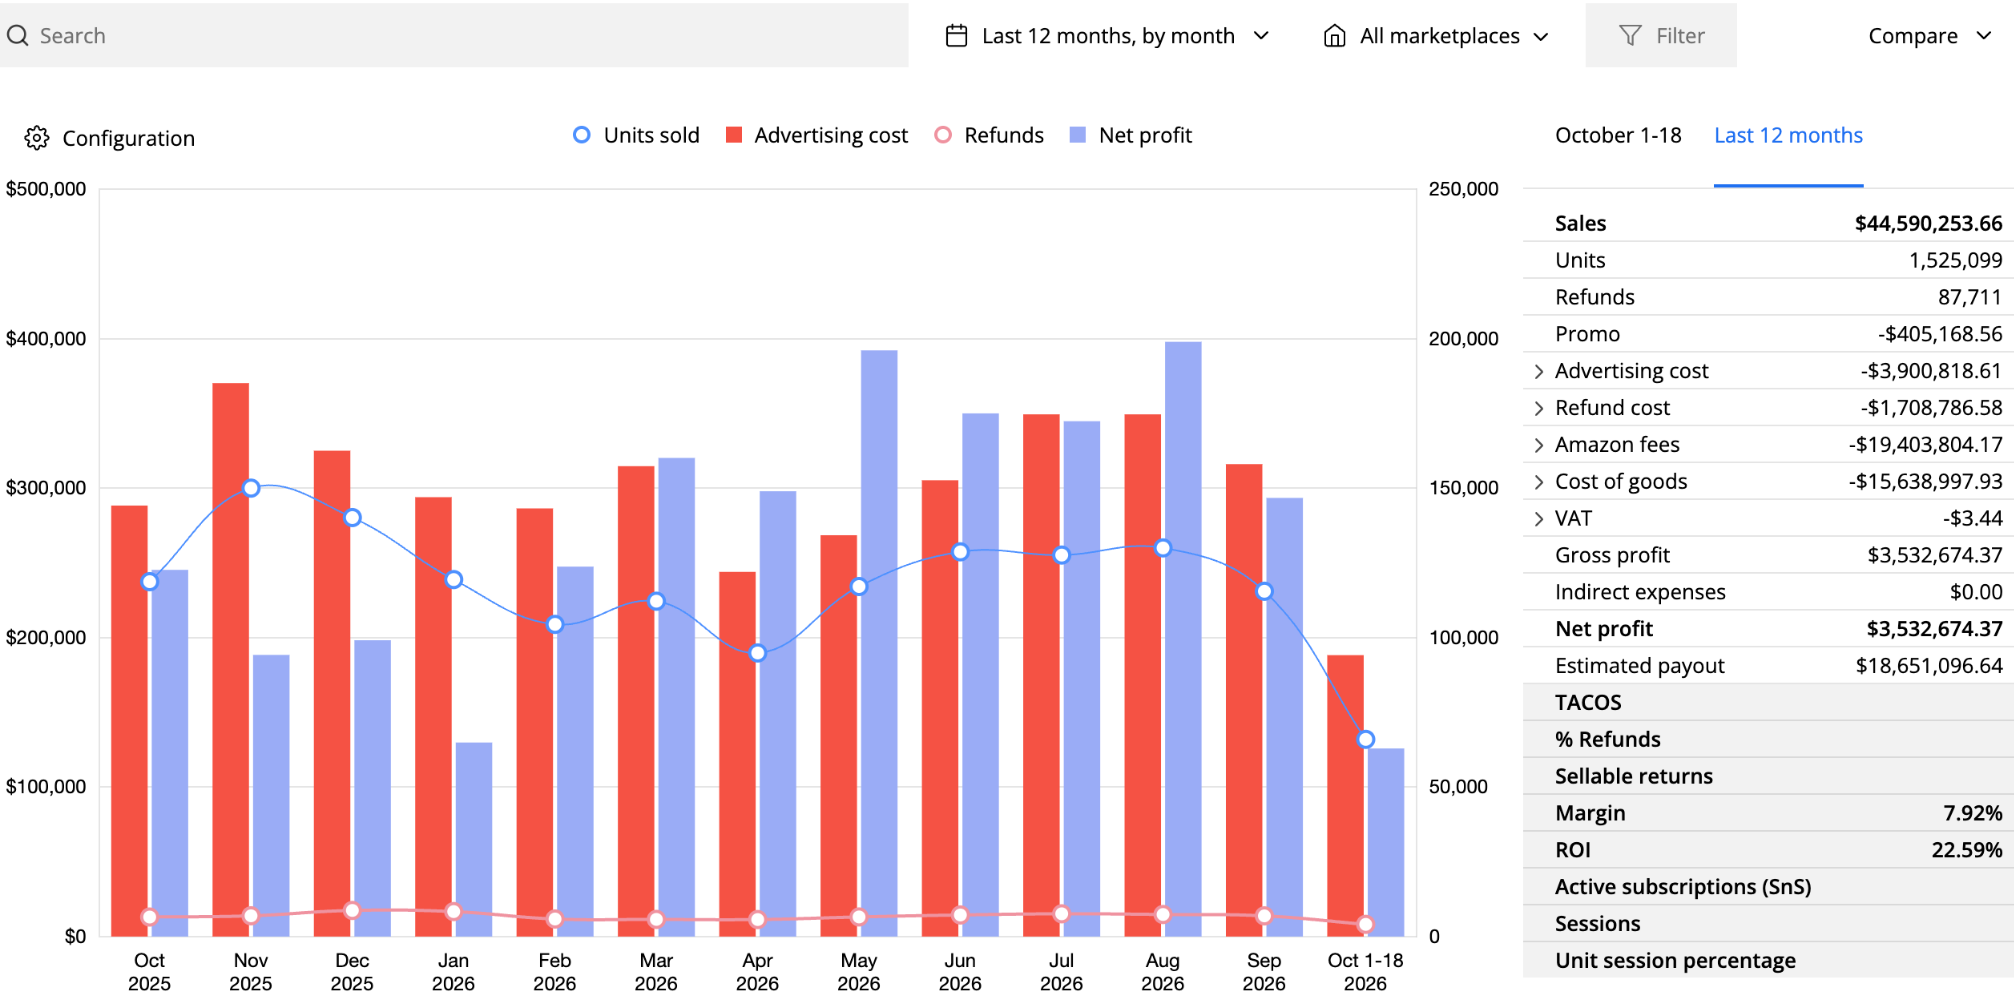
- Mar 2026 Engagement started
- Before Nov–Feb · ~$190K avg monthly net profit · ~$320K/mo ad spend
- After May–Aug · ~$370K avg monthly net profit · ~$320K/mo ad spend
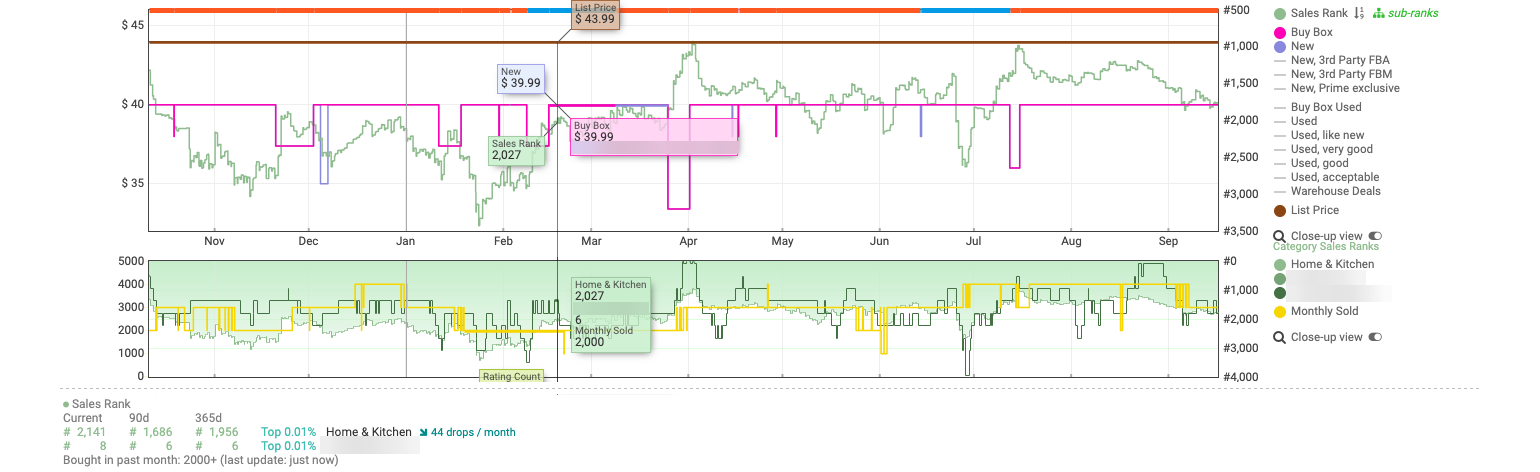
- Mar 2026 Engagement started
- Price Buy Box held ~$39.99 apart from short deal dips
- Rank 90-day average #1,686 vs 365-day average #1,956 (Home & Kitchen)
Clarity. Focus. Execution. Profitable growth.

About
From the Ads Console to the P&L.
I started in Amazon PPC in 2017. Since then I’ve led a PPC department, run marketing for an 8-figure Amazon portfolio and worked hands-on with established brands — always close to the numbers.
Today I work as a hands-on Amazon growth partner.
~9 yrs
hands-on on Amazon
200+
brands, launches & market entries
up to ~$3M
monthly ad budgets managed or overseen
6–8 figure
Amazon brands worked across
2017
PPC → Head of PPC
Team of 5 · ~60–70 clients
2021
Marketing Leadership
8-figure Amazon portfolio
2023
Independent Amazon Growth
$50M+ combined client revenue
2026
Senior Amazon Consultant, GNO
Leading Amazon consultancy · hands-on work across 20–25 Amazon brands
B.A. Business Administration · Finance & Capital MarketsMBA · Tel Aviv University · 2025–Present
Work with me
One engagement.
The whole growth engine.
The engagement
Amazon Growth Partnership
Full management of the commercial side of your Amazon business — run as one system, by one senior operator.
Not ad management, and not a checklist of optimizations. I own the growth engine end to end — and do the work myself.
Prefer to write first? Send an inquiry
Engagement scope depends on the size, complexity and priorities of the business.
What I run
Growth engine
- Advanced PPC management, with automation
- Launches and relaunches
Conversion & catalog
- Catalog restructuring
- Listing and creative work that lifts conversion
- Review strategy and improvement
Profit & expansion
- Fee optimization across multiple levers
- Expansion of the current catalog
- New marketplaces
How I operateBusiness-first prioritizationFast decisionsCut what doesn’t work
FAQ
Questions brands ask first.
Who do you work with?
Established Amazon brands, typically six to eight figures, that already sell and want growth that shows up in profit, not only in revenue.
Are you an agency?
No. You work with me directly. I set the priorities with you and do the work myself, inside your accounts.
What does “hands-on” mean in practice?
I work inside Seller Central and Amazon Ads myself: campaign structure, search terms, bids and budgets, placements, pricing, promotions, catalog and listings.
Can you work alongside an existing agency or internal team?
Yes. I can work alongside an internal team or an existing agency, as long as ownership and decision-making are clear. My role is to identify the priorities, align the work and stay hands-on where I can create the most impact.
Next step
Not sure which lever matters most?
That’s the first call.
One conversation. A clear view of where to focus.
Send an inquiry
Thank you — your inquiry has been sent.
I’ll reply directly to the email address you provided.